Rockfall Risk Map for Yosemite National Park
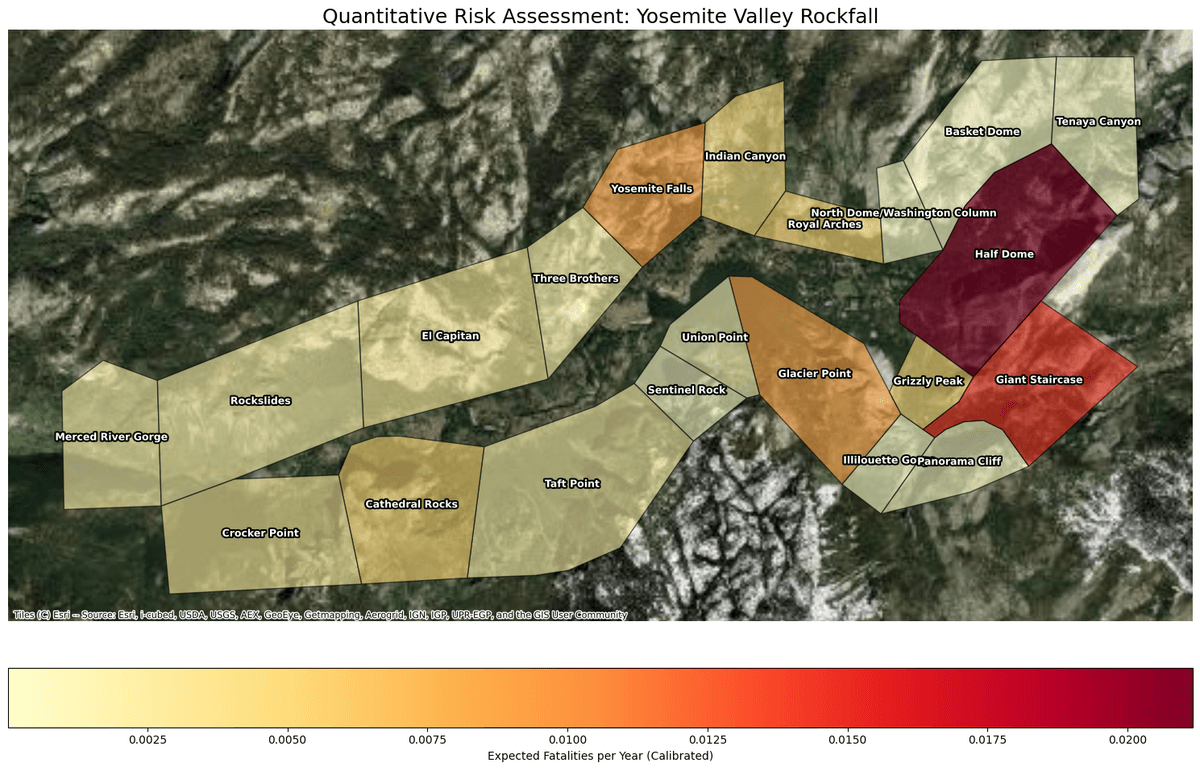
Rockfall risk zones for park visitors, mapped with a novel methodology built on visitor photos.
Rockfall is one of the most significant natural hazards in Yosemite Valley, where visitors gather directly beneath the park's granite walls. Quantifying the risk to people requires more than knowing where rocks fall — it requires knowing how many visitors are exposed in each location, and visitor exposure is notoriously hard to measure across a landscape this size.
I built a quantitative risk assessment following the standard individual-risk framework, R = H × P(S:H) × E × V, across 21 hand-digitized rockfall source zones drawn from the NPS DS 746 dataset. For the exposure term E, I used geotagged photo activity (photo-user-days) as a novel proxy for where and how densely visitors congregate.
Vulnerability V was modeled with a Beta(15, 85) distribution, and I propagated uncertainty across the full pipeline with a Monte Carlo simulation of 100,000 iterations, calibrating the result to the historical baseline of roughly 0.09 fatalities per year.
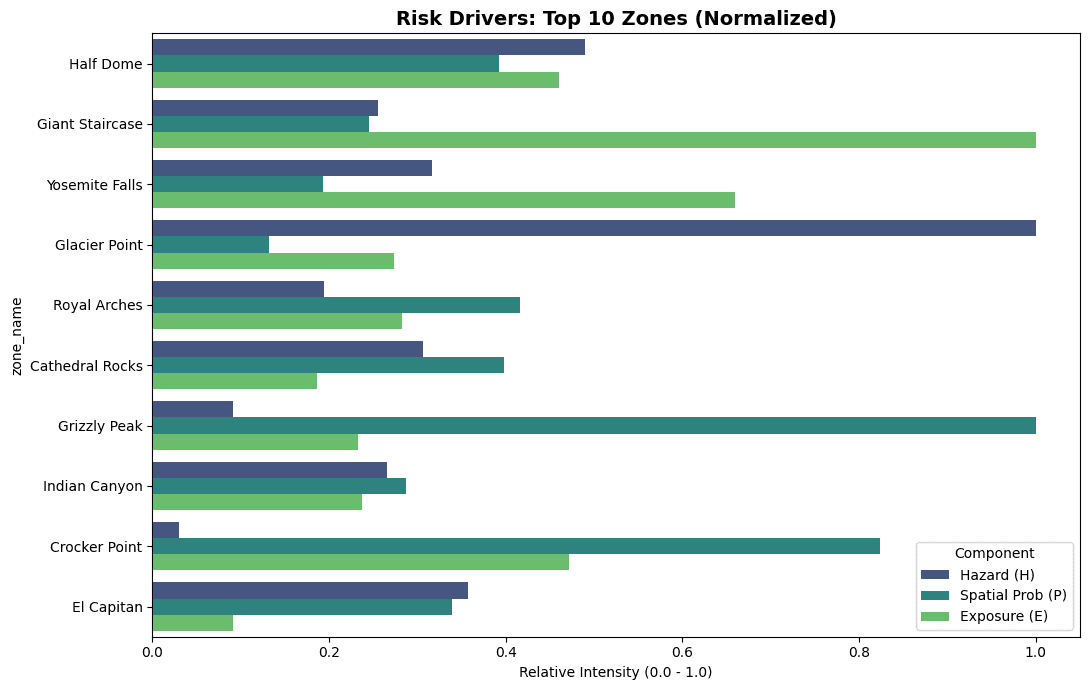
The output is a zone-by-zone risk map, to be packaged as an NPS-style risk poster visual for high-traffic areas such as Half Dome (Zone 11), so the findings read the way park visitors and staff are used to seeing hazard information. Additionally, the second output is a zone-by-zone risk driver analysis, which shows the relative contribution of each term in the risk equation to the total risk in each zone. This helps park staff understand which zones are most sensitive to changes in hazard, exposure, or vulnerability.